import numpy as np
import pandas as pd
import datetime
import matplotlib.pyplot as plt
#dataframe вида:
a = pd.date_range('2019-01', '2021-07', freq='M')
data = {'b1': np.random.randint(0, 7, 30),
'b2': np.random.randint(0, 7, 30),
'b3': np.random.randint(0, 7, 30)}
frame = pd.DataFrame(data, index=a)
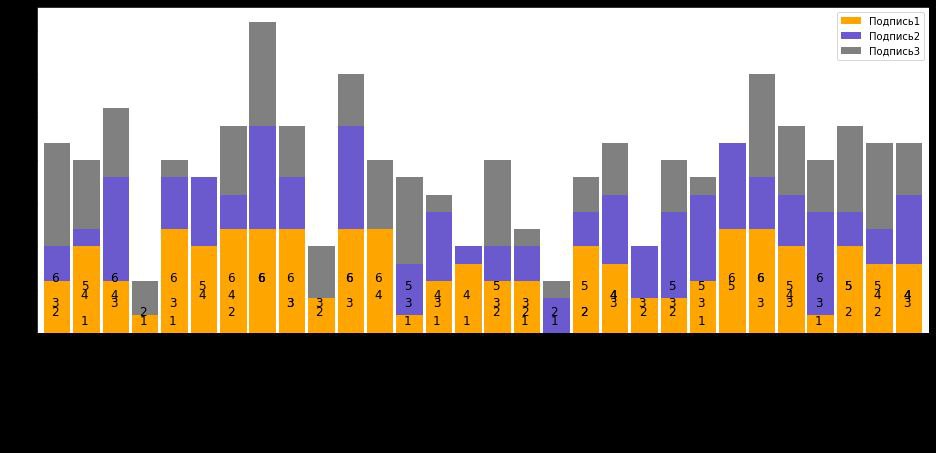
# построение диаграммы (гистограмма с накоплением):
y1 = frame['b1']
y2 = frame['b2']
y3 = frame['b3']
frame.b1.plot(kind='bar', width = 0.9, color='orange', stacked=True, label='Подпись1', figsize=(16,6))
frame.b2.plot(kind='bar', width = 0.9, color='slateblue', stacked=True, bottom=y1, label='Подпись2', figsize=(16,6))
frame.b3.plot(kind='bar', width = 0.9, color='grey', stacked=True, bottom=y1+y2, label='Подпись3', figsize=(16,6))
plt.legend()
# подписи к диаграмме:
for index, y1 in enumerate(y1):
if y1 != 0:
plt.text(x=index-0.2, y = y1*0.5, s=f"{y1}", fontdict=dict(fontsize=12))
for index, y2 in enumerate(y2):
if y2 != 0:
plt.text(x=index-0.2, y = y2*0.5, s=f"{y2}", fontdict=dict(fontsize=12))
for index, y3 in enumerate(y3):
if y3 != 0:
plt.text(x=index-0.2, y = y3*0.5, s=f"{y3}", fontdict=dict(fontsize=12))